Statistical Key Figures and Reporting in Universal Cost Allocation
by Daniel Mateo
 This is the third and final blog in a series of three about Universal Cost Allocation.
If you have not already done so, please read Part 1 and Part 2 of this series, linked below.
Part 1: An Introduction to Universal Cost Allocation
Part 2: Cost Allocations in S/4HANA
This final segment discusses two of the main processes in Universal Cost Allocation: Statistical Key Figures and Reporting.
As you saw in the previous blog, we have already looked at Cost Allocations, another critical process that is executed in the Univeral Cost Allocation functionality.
Statistical Key Figures
A statistical key figure is a number providing information about non-monetary data assigned to cost centers: number of employees, number of computers... They can be assigned as a reference within rules in allocation cycles.
Master Data
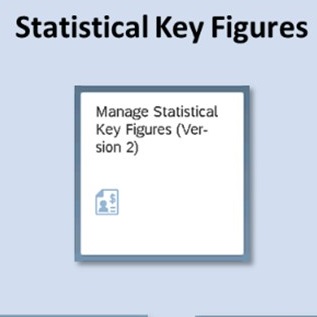
The following Fiori App allows you to create, copy, modify, and display the statistical key figures according to specific filter criteria.
At the top of the screen, there is a selection screen to filter statistical key figures for the desired criteria. Once the system displays the items that match the selection, it is possible to edit an existing statistical key figure or create a new one.
In case of creating a new one, it is populated with the code of the statistical key figure, its description, the assigned controlling area, the unit to measure it, and if it is an accumulated amount (for instance gross operating profit) or fixes value (for instance number of computers).
Once clicking on Save, the following pop-up is displayed.
Then, the new statistical key figure is displayed in the list after refreshing it.
Manual Posting
The following Fiori App allows you to post manual documents affecting statistical key figures.
In the header, data is maintained the controlling area, the dates of the documents, and the document text. Then, in each of the document items is populated the amount of each statistical key figure assigned to the receiver cost center. For instance, the number of computers assigned to each department that corresponds to a cost center.
Once clicking on Post, the document is created and the number is displayed at the bottom of the screen.
Import From Template
The following Fiori App allows you to upload statistical key figure plan data from a comma-separated values file (CSV file).
In this App, it is possible to download the template to be maintained or to import the CSV file browsing on the computer.
In the case of downloading the template, the user can choose the separator for the file.
Find below the template to upload the statistical key figures postings. That makes it faster to post within the figures in case of a large number of items to incorporate in the system.
Reporting
Universal Cost Allocation provides several standard reporting in Fiori to analyze the amounts posted within cost elements in user friendly and homogenous way. In this post, the main reporting for statistical key figures and cost centers will be presented.
Statistical Key Figures
The following Fiori App provides an analytical report with the actual postings in statistical key figures.
Once executing the App, the selection screen to filter the records is displayed in a pop-up window. It is possible to filter by cost centers and statistical key figures for a given period of time.
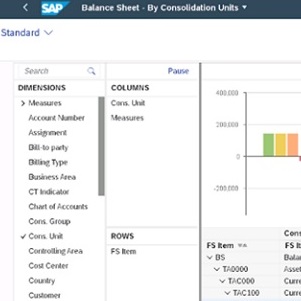
The report will display by default the actual amount in each statistical key figure by cost center. It is possible to add further dimensions to the columns or rows to enhance the analysis required. As an analytical report, a graph can be displayed with the items selected or export the records to a spreadsheet file.
Cost Centers
The following Fiori App provides an analytical report to compare the actual and plan postings in cost centers.
Once executing the App, the selection screen to filter the records is displayed at the top of the screen. It is possible to filter by cost centers, profit centers, and GL accounts for a given period of time.
The report will display by default the balance for actual and plan postings in each cost center by GL account. It is possible to add further dimensions to the columns or rows to enhance the analysis required.
There is the option to expand the results to analyze them. Find below the actual balance for some of the cost centers prior to executing the cost allocation.
Once the cost allocation has been executed in live mode, the sender cost centers are credited using the secondary cost account maintained in the segment. In the case of cost center 17101201, there is a remaining amount of 232500USD related to Payroll Expenses since this account was not included in the selection criteria in the allocation cycle.
And the receiver's cost centers are debited using the same secondary cost account as displayed below.
The report has the option to navigate to the line items report to analyze with further details the item selected. As an analytical report, a graph can also be generated with the items selected or export the records to a spreadsheet file.
After reading these three blogs, you should have a solid understanding of the new simplified SAP functionality: Universal Cost Allocation in S/4HANA.
by Daniel Mateo
More Blogs by Daniel Mateo


Introduction to Universal Cost Allocation in S/4HANA
Universal Cost Allocation is the new simplified functionality in SAP S...

Group Reporting Process Flow in S/4HANA
This is the final part of a three-series blog discussing Group Reporti...
Related Blogs

Introduction to Universal Cost Allocation in S/4HANA
Universal Cost Allocation is the new simplified functionality in SAP S...

Group Reporting Process Flow in S/4HANA
This is the final part of a three-series blog discussing Group Reporti...
.png)

